

Hidden Water
Visualizing the Water Footprint of Crops
Developed a transferable computational framework visualizing hidden water footprints across crop supply chains to make invisible resource flows legible.
Research Project · Harvard MDE
Role: Concept Development · Data Cleaning · System Design · Data Modelling · Computational Analysis · Data Visualization
Team: Hana Khurshid, Michael Chang
Hidden Water is a data-driven design research project that investigates the invisible water embedded in everyday food systems. While water underpins nearly every product we consume, much of its use - particularly in agriculture - remains hidden from view. This project focuses on making those hidden flows legible through computation and visualization.
The work proposes a transferable framework for calculating crop-level water footprints across regions and supply chains. Using almonds and avocados as case studies, the project models blue, green, and gray water across growth, processing, and distribution, revealing how climate, infrastructure, and logistics shape total water use. By translating complex datasets into visual systems, Hidden Water exposes counterintuitive outcomes and identifies leverage points for more informed decision-making.

The project establishes a modular framework for calculating water footprints across crops and regions. System boundaries were defined to balance accuracy and scalability, focusing on growth, harvesting, processing, and distribution while excluding stages with excessive uncertainty.

Stage 1: Explanation of calculation

Stage 2: Explanation of calculation
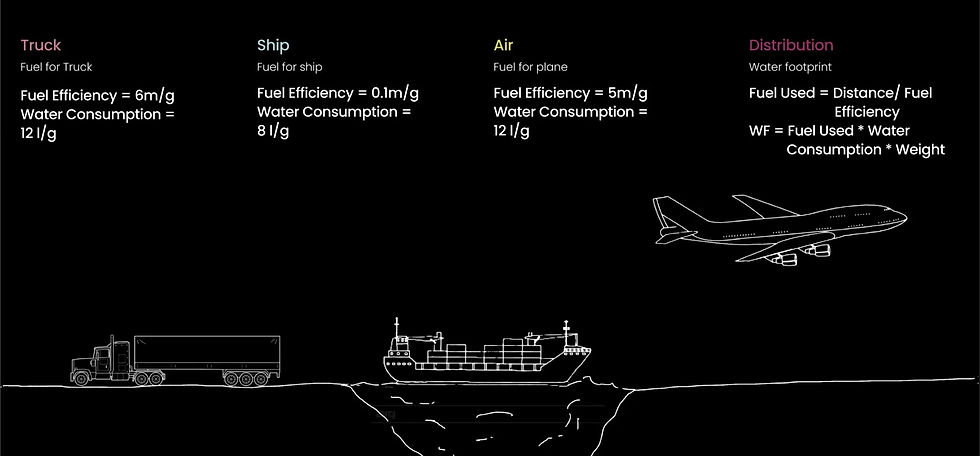
Stage 3: Explanation of calculation
Comparative Case Studies
The framework was tested across multiple crops and geographies to evaluate how climate, irrigation practices, and supply chains influence total water footprint.
Almonds

Water Footprint of Almond grown in California consumed in Canada

Hover over each stage to see more information on the crop

Click on each stage to see the breakdown of water
Californian Avocados

Water Footprint of Avocado grown in California consumed in Canada

Click on each stage to see the breakdown of water
Mexican Avocados

Water Footprint of Avocado grown in Mexico consumed in California

Click on each stage to see the breakdown of water
Comparative analysis revealed significant differences in water footprint based on geography. Avocados grown in California required approximately 525.5 liters of water per unit, while avocados grown in Mexico and consumed in California required 355.3 liters. This disparity highlights how climate conditions, irrigation practices, and supply chains can outweigh assumptions about local production. By making these differences visible, the framework supports more informed decision-making; both for policymakers evaluating crop suitability and for consumers seeking lower-impact choices.
Video of Data Visualization App